


Hello there,
In February of 2025, indie hacker Pieter Levels(@levelsio) built an AI-generated flight simulator game that reportedly reached 32K players and $87K in revenue within 17 days. Players could buy planes in-game, while advertisers could put their brands on blimps and billboards. Even Elon Musk and Patrick Collison were among the game’s notable players.
It was an early glimpse of what AI could mean for indie game development: smaller teams, lower barriers to building, and the ability to get a product in front of an audience remarkably quickly.
Fast-forward to September 26, 2026, when Berlin-based Nigerian engineer Opeyemi Adeniran tweeted out Lagos Run(now renamed Danfo Run), a browser game that let players navigate the streets of Lagos as a danfo driver. It went viral on Nigerian Twitter, with developers quickly spinning out their own clones of the game, kickstarting yet another gaming renaissance in the Nigerian ecosystem.

With Nigeria’s Independence Day approaching, and no club football on the calendar, Nigeria’s internet found a new distraction in playing and creating localised mods of popular games.
Then, on October 1, UK-based Nigerian developer Shalom Rayhamen quoted Opeyemi’s tweet with Lagos Life, an AI-built mode on The Sims set in Lagos.

And the rest was history. Lagos Life hit 1 million users in three days, faster than ChatGPT's 2022 record of five days. By day four, they reported revenues of $46K, and by day nine, they reported revenues of $170K; 5 million users and had closed a $500K angel round valuing the parent company behind the game at $10 million.
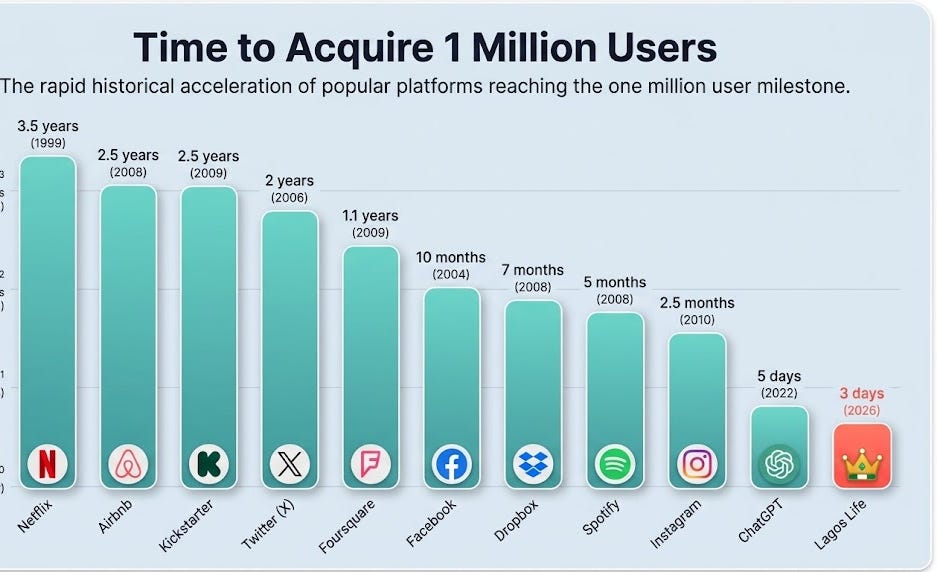
One of the headline questions of the week from the TBPN crew was on the viability of AI video game mods as a category. Lagos Life, and Danfo Run before it, have just answered that question.
5 million players have proven that there is clearly an audience for familiar game formats reimagined around local experiences. This is an exciting moment for Nigerian developers and the investors backing them. Commentary on retention rates and business durability of the category can be entertained later.
As for now, it’s just day 1
Good luck to everybody building.
And now, let’s get into this week’s newsletter.

If you are in crypto, chances are you have come across those inflated big numbers from blogs about how much crypto Nigerians move and where the country ranks in terms of crypto adoption. What is often missing from those reports is a granular picture of what Nigerians actually do with crypto, particularly as stablecoin activity grows.
Enter AfriFlux, a data intelligence and media outfit that tracks on-chain activity flowing into African crypto exchanges and neobank platforms. In this piece, we’ll call these platforms venues.
Its flagship Terminal gives researchers, regulators, neobanks and crypto companies near-real-time visibility into onchain activity across the venues it tracks, adopting a Bloomberg Terminal-inspired approach to market intelligence. Its media and research arm then turns that data into stories about how the market works.
AfriFlux has been useful in some of the research I’ve done over the past month, including looking at on-chain activity connected to Dangote Refinery.
Similar to the successes of Danfo Run and Lagos Life above, their advantage is local market context: global data platforms such as Dune, Messari and Artemis can help us explore blockchain activity, but understanding what those transactions mean in a market like Nigeria requires more than looking at the chain.
AfriFlux wants to build that missing layer of on-chain intelligence for African markets.
Below is its analysis of Nigerian stablecoin activity in Q3 2026.
Same Dollar, Different Products - AfriFlux’s Q3 look at Nigeria’s On-chain money movement.
Nigerian fintech is often discussed as one market: “people just want to buy Dollars”.
If that were simply the case, our on-chain data for Q3 would not have highlighted a key trend which shows each Dollar-enabled product drawing distinct types of users. Depending on where it is spent, the same Dollar stablecoin can support very different use cases, each with its own pattern of usage.
In Q3 2026, AfriFlux tracked 239,190 customer deposit addresses across 22 Nigerian venues. Those addresses received $528 million in USDT and USDC deposits across 12 blockchains.
What these addresses did — how much they deposited, whether they came back, and where else they sent money — reads like a map of the different products operating beneath Nigeria’s broad stablecoin market.
How we read behaviour from wallets
Every app in our coverage gives customers deposit addresses on the blockchains it supports. AfriFlux maps those addresses and tracks USDT and USDC deposits into them.
The deposit address is our unit of analysis. It is not a person, since one person can have several addresses across venues and chains, but it is the closest public trace of one customer account on one chain.
Two signals do most of the work below: deposit size and whether a newly depositing address receives a second deposit.
Same Dollar, different products
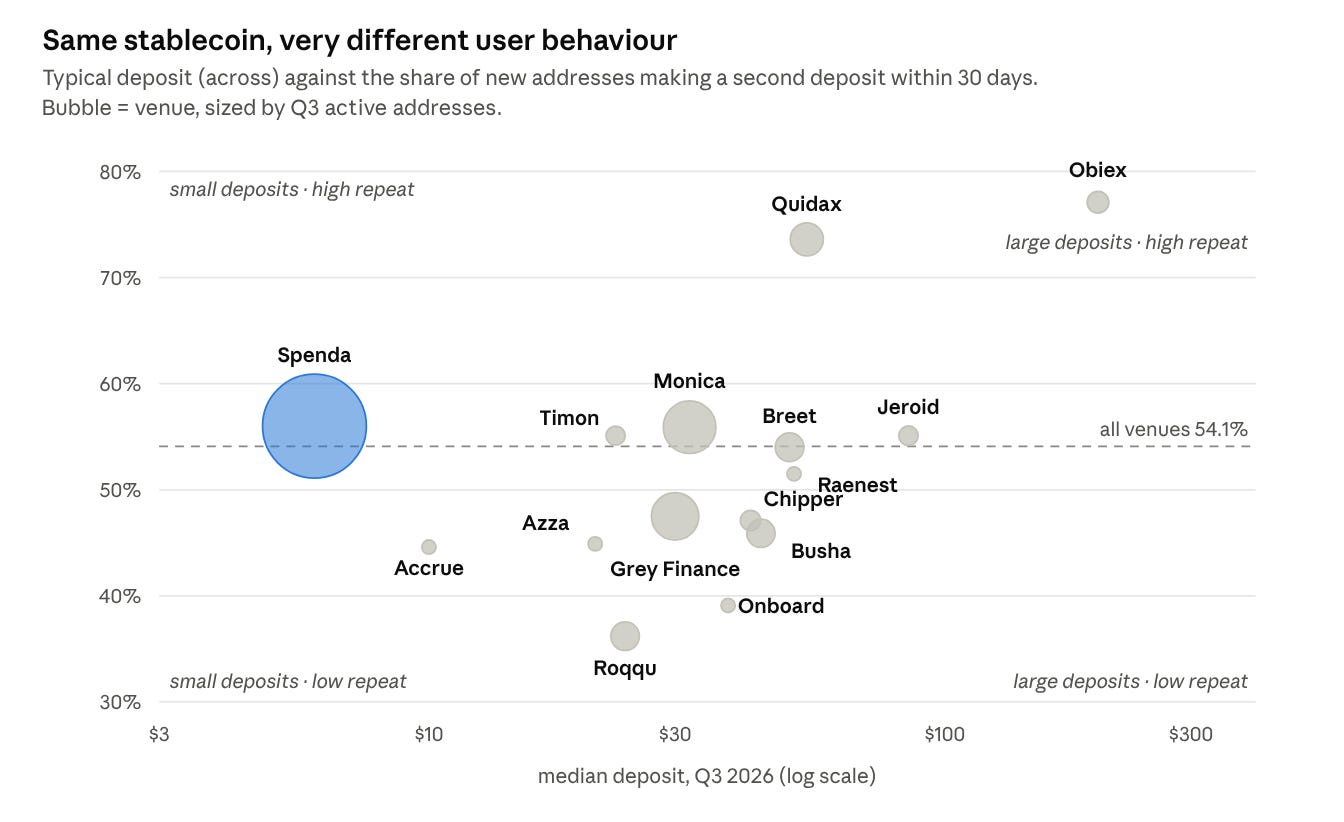
Plotting the typical deposit size alongside the share of new addresses that make another deposit, and the venues begin to cluster by product type.
What kind of product is this?
Spenda: Everyday. Small deposits, repeated. Spenda has 119,217 addresses, the most of any venue in our coverage. Its typical deposit is $6, and 56% of new addresses make another deposit within a month.
Quidax and Obiex: Exchanges. Repeat, multi-use activity. Seventy-four per cent of new addresses at Quidax and 77% at Obiex make a second deposit within 30 days.
Roqqu and Onboard: On-ramps. Lower repeat-deposit rates: 36% at Roqqu and 39% at Onboard. Onboard needs a caveat, however, because a significant share of its deposits reflects virtual-account payments rather than users choosing to top up their crypto balances.
Daya Pro: Large-ticket. Its typical deposit is $600, the largest in our coverage. There are too few new addresses to construct a reliable return-rate cohort, so Daya Pro sits outside the chart.
This is not a ranking of better and worse apps. Different deposit patterns point to different behaviours, although deposit size and frequency alone cannot tell us everything about a venue’s customers or business model.
The same Dollar stablecoin can serve very different purposes.
The second-deposit rate held as new addresses doubled
In crypto and fintech, a second deposit is one of the clearest signals that a new address has become an active user. It is not the same as product retention, but it gives us a useful way to compare repeat funding behaviour.
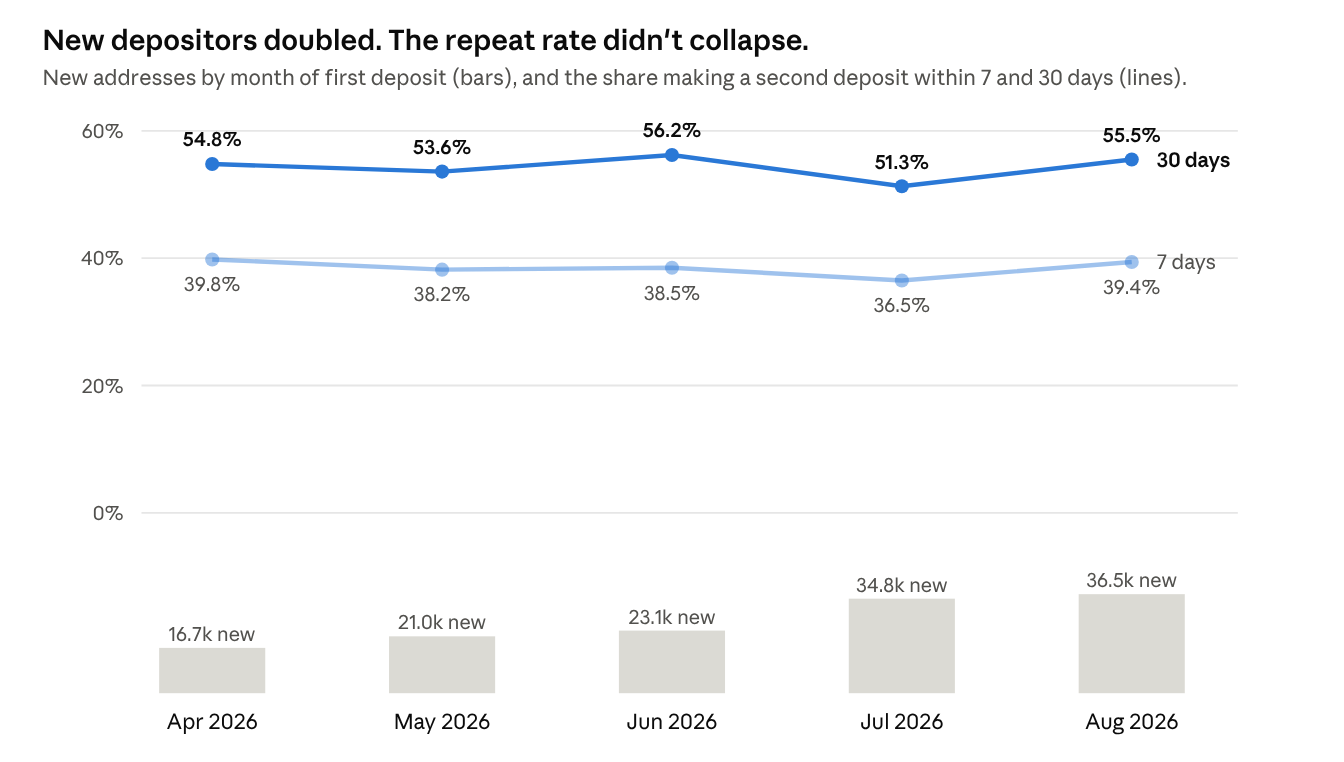
Across all venues in our coverage, 38% of new deposit taking addresses made a second deposit within seven days, and 54% did so within 30 days.
The number of new deposit-taking addresses more than doubled between April and August, from 16,690 to 36,489 a month, while the 30-day second-deposit rate held steady.
Within our coverage, the growth in new deposit addresses did not dilute the share that returned to deposit again.
Exchanges activate fastest. A typical new address that returned to Obiex made its second deposit within 0.7 days; at Busha it took about a week.
These are repeat-deposit signals, not measures of overall product retention. A customer can remain active inside an app without making another on-chain deposit, and an address that deposits twice is not necessarily a profitable or long-term customer.
Averages hide who a product serves
Deposit averages tell only part of the story. To understand the money flowing through a venue, we also need to know how concentrated that money is and how frequently addresses deposit.
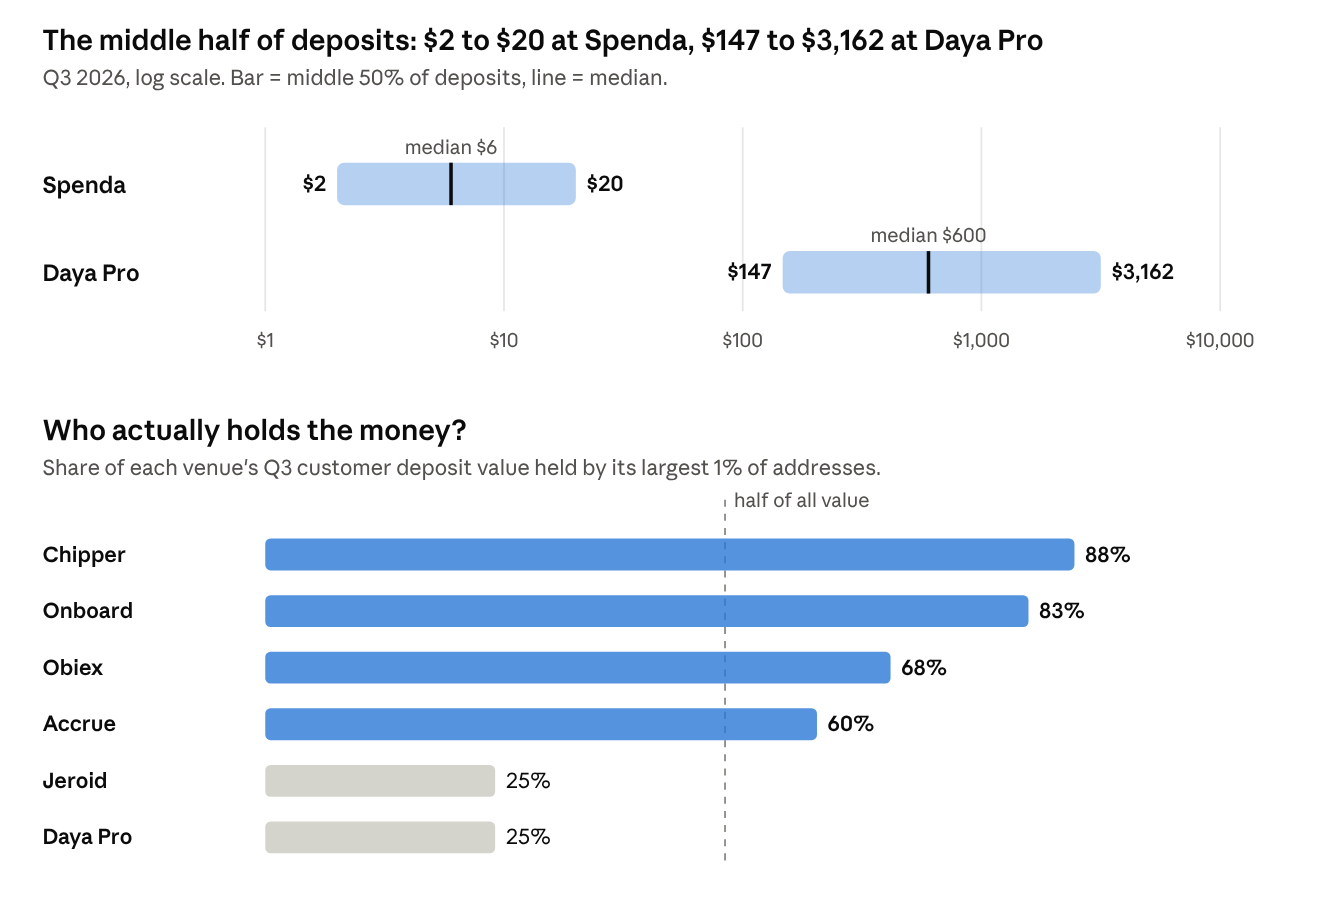
At some venues, a thin top carries most of the money: the top 1% of addresses carry most of the customer value at Chipper, Onboard, Obiex and Accrue. At Jeroid and Daya Pro, value is spread across a broader set of depositors. A venue with many addresses is not automatically a mass-market product; concentration is the key measure.
Frequency tells a similar story. During Q3, 27% of Obiex addresses and 24% of Daya Pro addresses made 20 or more deposits. At Chipper, Timon and Raenest, fewer than 3% did so; most addresses deposited between one and four times.
This is an important distinction. A venue with many deposit addresses is not automatically a mass-market product. The distribution of value matters as much as the number of addresses.
These patterns suggest differences in how customers fund and use the venues. They do not, on their own, tell us why those differences exist or how much revenue each group generates.
The token may be the app’s default
USDT is the default almost everywhere, and users rarely switch: in most venues, fewer than one in ten addresses used both USDT and USDC in Q3.
Chipper is the exception here, as 62% of its customer value arrived in USDC, and its typical USDC deposit was about three times the size of its typical USDT deposit.
Chuk Okpalugo had written about a tale of two cities when it comes to stablecoins. It seems that stablecoin choice is a product default rather than a user preference.

Users move between apps
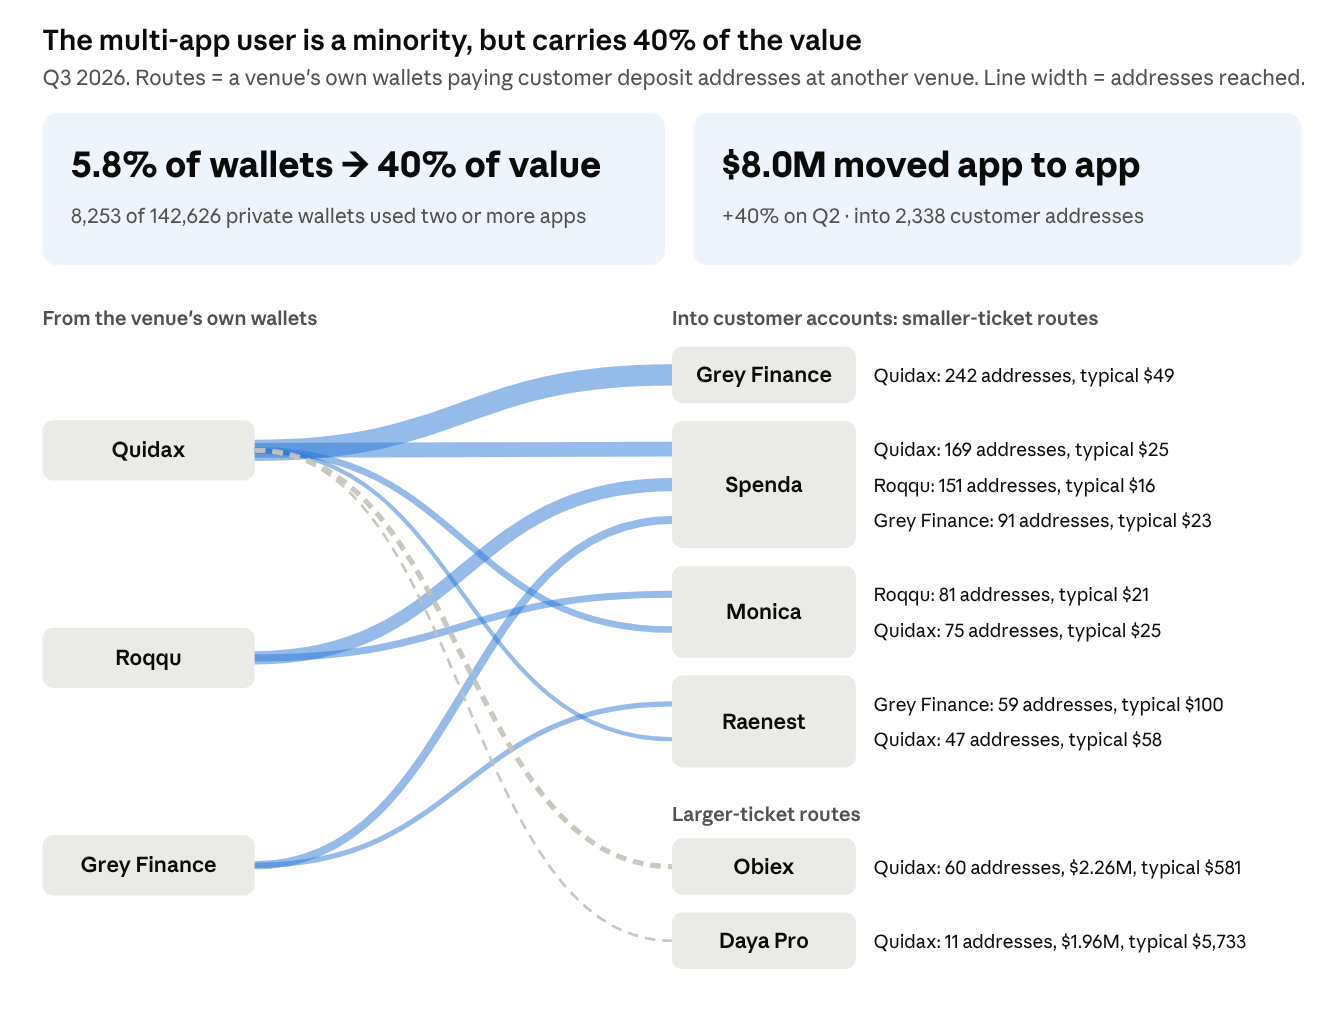
Most depositors in our coverage sent money to just one venue. The smaller group that funded several venues, however, accounted for a substantial share of the value.
Of 142,626 private wallets that paid into customer deposit addresses during Q3, 5.8% paid into addresses at two or more venues; those wallets also accounted for 40% of the value.
We excluded wallets belonging to exchanges, venues, deposit systems and payment rails so that a venue’s hot wallet would not be mistaken for a personal wallet.
There is another direct signal of movement between apps: a venue’s own wallet sending funds to a customer deposit address at another venue. This gives us evidence of money moving from one platform directly into an account at another, rather than merely observing the same external wallet funding both.
In Q3, these traced transfers totalled $8 million across 2,338 destination addresses, up 40% from Q2. Quidax’s wallets accounted for 59% of the observed transfer value.
The smaller-ticket routes include many addresses receiving relatively small transfers, particularly from exchanges into everyday apps. Larger-ticket routes include transfers from Quidax into Obiex and Daya Pro.
A new kind of user: the Dangote Refinery IPO
In September, a different kind of financial activity appeared in our data.
From September 14, shares in the Dangote Petroleum Refinery IPO could be purchased onchain at ₦525 each through GetEquity’s tokenised offering. By September 30, 235 wallets had bought shares.
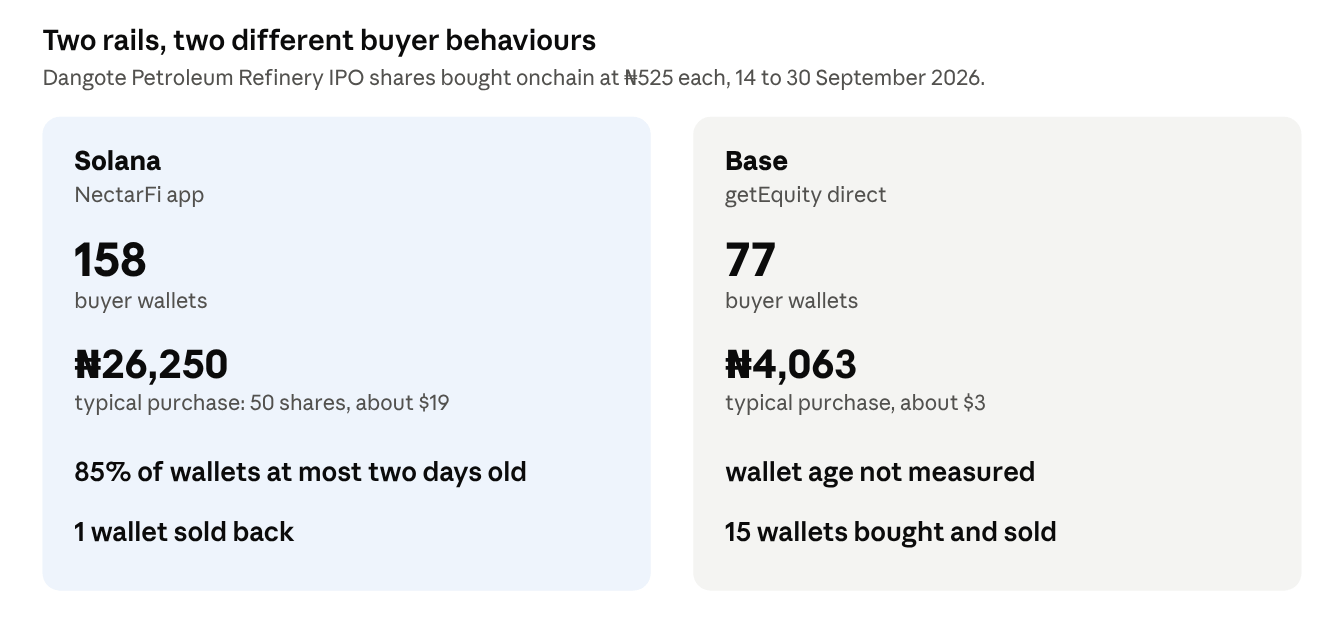
The wallet patterns are consistent with the onboarding of new investors making relatively small initial purchases. Most NectarFi buyers used wallets created a day or two before buying, which in crypto signifies a seamless onboarding process for new customers.
Buyers paid in USDC; the app converted it into cNGN, the naira stablecoin, and used that to purchase the shares within the same flow.
59% of the net shares held at September 30 had been bought in the first three days.
What is significant here is that a Dollar stablecoin was used to acquire a Nigerian equity through a naira stablecoin in a single transaction flow. That is a concrete example of how stablecoin infrastructure can connect different financial products. (read our piece on tokenization here)
The early wallet activity does not establish how many buyers were entirely new to investing, or whether demand will persist. But it gives us a useful case study in how a stablecoin-funded investment product can work.
What the wallets can and cannot tell us
An address is not a person. One person can have several addresses across venues and chains, which means address counts exceed the number of actual people. The return rates also understate how many people may come back, because an individual can return through a different address. And a second deposit is not the same as retention.
Some deposits also reflect payment flows rather than a customer’s decision to top up an account.
On Onboard, most deposits on Base are associated with US-Dollar virtual accounts. These payments flow directly into customers’ deposit addresses via Bridge, accounting for 55% of Onboard’s Base deposits in Q3. Its growth on Tron comes from 70 high-value retail addresses averaging about $98,000 each.
Onboard’s figures therefore describe payments received as well as user behaviour. They should not be read as a clean measure of organic app adoption.
Public blockchains show deposit activity. They do not show everything that happens inside an app. Conversions, balances, internal transactions and fiat withdrawals may take place offchain, outside the view available to this analysis.
Summary
A narrative of Nigerian crypto activity can be summarised into the following patterns:
An everyday wallet associated with small, frequent deposits.
Exchanges with higher rates of repeat deposits.
Products where a small group of large depositors accounts for much of the volume.
Customers funding multiple venues, alongside direct transfers between apps.
🆕 Investment products that use stablecoins to connect Dollar-denominated funds with local-currency assets.
The stablecoin is the same. The products are not.
We don’t estimate markets; we map the part we can see. We don’t assume identity; we attribute what the wallets prove. And we don’t stop at volume; we follow the relationships between companies. — AfriFlux
About the data. AfriFlux maps Nigerian exchanges, offramps, neobanks and payment companies wallet by wallet. In Q3 2026, from July 1 to September 30, we monitored USDT and USDC deposits. This was done at specific customer deposit addresses in Nigerian venues across 12 blockchains. Customer and business-class activity are classified from on-chain behaviour; business-class flow is excluded here, but at venues that serve both through the same accounts, all activity is counted in full. Cohorts cover addresses whose first-ever deposit fell between April and August 2026. Dangote IPO figures are read from getEquity’s sale contracts on Solana and Base. Routes between apps are named only where a venue’s own wallets prove them; unidentified flows remain unidentified.
Important: these figures represent AfriFlux’s observed coverage, not an estimate of the total Nigerian stablecoin market. Onchain data cannot capture internal ledgers, offchain fiat settlement or wallets we cannot confidently attribute.
About AfriFlux. AfriFlux measures Africa’s onchain money, wallet by wallet. The full State of Nigeria’s Onchain Money report for Q3 2026 follows this series.
A Few Nice Links
4 Roads to The Nigerian Dream - Uncle Tunde’s Insights
The inevitability of local stablecoins - Lombard Notes
Will agents have network effects? - Andrew Chen
💰 Whop Whop Whop - A 15-minute bank and other bad ideas. - Fintech Takes
When everyone can build a bank. Who runs it? - Fintech Brainfood
What the African fintech valuation conversation keeps leaving out - African Comms Intelligence
A warning about ‘model welfare’ - Mustafa Suleyman
05: PiggyVest helped Nigerians save and became more than a savings app - Class of 2106 Series by TechCabal
Creative Intelligence report 2026 - Contra Labs